Monetary Policy? Start here.

Monetary Policy is an extremely important but often complex part of Economics. 

I think the most challenging part of learning Monetary Policy is that so much of the content builds on more content and it only really makes sense at the end of the process.

This is often frustrating for students (and teachers). 

So, where do you start? If you’re an absolute beginner and you’re keen on learning the process of Monetary Policy, I’ve created a series of videos to take you step-by-step through the process.

Start here. This will set you up on a solid foundation. There’s also links in the description for the next videos in the series.

What shape will Australia's recovery be?

Will Australia’s economic recovery be short and sharp? Or will it be protracted, with economic growth remaining sluggish for sometime following COVID-19?

Depends on who you ask.

The source for this discussion is a great article by the economist Jason Murphy titled Coronavirus Australia: What if the economic recovery is not V-shaped?

Let’s start with the optimistic view: the V-shaped recovery. This looks like it sounds: a plunge down, small time at the bottom, and then a quick escalation up. According to the International Monetary Fund (IMF), this is how Australia’s economic recovery will proceed.

V-shaped economic recovery. Source: news.com.au (click through for article)

V-shaped economic recovery. Source: news.com.au (click through for article)

As Murphy writes: “This is a very bad recession. But at least it is quite short. The assumption the IMF makes is that the economy bounces back when the virus is defeated.”

Okay, but what if the IMF is wrong? 

The pessimistic alternative is an L-shaped recovery. Basically, growth drops (the vertical line of the L), and then we spend a long time along the bottom of the L until growth speeds up. This is a more painful economic recovery as it takes much longer to see a rebound in economic growth rates and employment.

Source: The Conversation (click through for article)

Source: The Conversation (click through for article)

This is how Greg Jericho, The Guardian’s economics writer, describes the L-shaped scenario: “Finally there is the dreaded “L” shape, in which the economy stays weak for even longer – five to 10 years of barely enough growth to keep unemployment flat, but not enough to improve things all that much.”

So what happens next? It’s going to be a wait and see. In terms of Australia, it will depend on the success of re-opening the economy and getting life and business back to normal.

What's the real impact of the minimum wage?

Economists often disagree on things. One of those ‘things’ is the minimum wage.

Let’s think about minimum wages. A minimum wage is a form of price intervention by governments. They intervene in the free market, they get their hands dirty, to ‘fix’ the equilibrium wage in the market.

You see, by imposing a minimum wage, the government is saying that the equilibrium wage (represented by point A) in the market is too low. It needs to be higher. So, the government sets it higher.

The whole process is laid out in the graph below. The government’s minimum wage (WMIN) is above the equilibrium wage and leads to the quantity of labour supplied (people looking for work, point C) exceeding the quantity of labour required by firms (point B). The result is the excess supply of labour and unemployment.

Some annotated class work about the economic impact of a minimum wage.

Some annotated class work about the economic impact of a minimum wage.

But! It’s important to note that this is what economic theory suggests. The reality is far more contested. Economists have a range of views on what actually happens when a minimum wage is imposed, or increased. 

Many economists do not believe that a rise in minimum wages will increase unemployment. Some economists have found that minimum wages may increase unemployment for some groups, such as young workers, but not all workers. And other economists have found that if minimum wages are imposed, employers will look to save money in other areas, such as by reducing the quality of working conditions.

I did a quick look at some of these different views and you can see the video below.

The point is that, in Economics, we need to be able to distinguish between the economic theory and the real world. Sometimes they don’t precisely match up and it’s important for us to point this out.


How to solve the economic problem?

In a previous blog post I looked at the economic problem. That is, how do economies solve the challenges of scarce resources and unlimited wants. 

This economic problem applies to individuals, companies and governments. But, at an economy-wide (country-wide) level, how does a government seek to solve the economic problem?

The key element is that a government must make choices. It must prioritise how it uses the scarce resources to achieve the best outcomes for society as a whole. 

There are four key economic questions that a society needs to answer.

Economic question one: What to produce?

An economy cannot produce every single good and/or service demanded by consumers and businesses. It does not have sufficient resources to do this. Instead it must choose which goods and services to produce...and maybe import the others from overseas.

Economic question two: How much to produce?

An economy cannot produce an infinite number of goods and services. Scarce resources put a limit on production levels. Here, a government wants to avoid waste. For example, if you produce more goods than consumers demand, you’ve got excess supply and a bunch of products sitting on shelves.

Economic question three: How to produce?

How will an economy make the goods and services? Labour? Capital? A mix? The key here is to make the goods and services efficiently — so with as little waste as possible. Maximum output for the inputs!

Economic question four: How to distribute production?

Who gets to access the goods and services? Does it depend on your income? Are they subsidised by the government? Are they given out free? This will depend on the goals of the government (whether it’s essential for everyone to have this good or service) and the role of the free market.

The challenge for governments is the difficulty in getting these questions ‘right’. It is hard to predict which goods and services to make — particularly how much of each to produce to precisely meet demand. Governments (and markets) don’t always get it right when answering the economic questions.

View from 3:15 onwards.

What's the (economic) problem?

One of my favourite questions to get as an Economics teacher is: what is Economics?

My answer?

Economics is all about trying to solve a problem. A very specific problem. The problem of scarce resources and unlimited wants.

Think about it this way. You want to learn a musical instrument. You want the instrument, you want a teacher, you want the time to practice and you want to get good. Look at all these wants.

But! You’ve got limited money (with which to buy the equipment and hire a teacher) and limited time (to practice and take lessons). 

Your wants are large but your resources are limited. 

In Economics, this issue is known as the economic problem. That is, how does a whole society solve the problem of scarce resources and unlimited wants? 

Essentially, if an economy (or an individual) can’t have everything it wants, it must choose. It must prioritise, it must select one course of action over another. 

If you want to practice the instrument, you’re going to have to sacrifice doing something else.

If a restaurant wishes to employ another chef, maybe it can’t buy a new oven at the same time. Not enough resources (money). 

Governments deal with the economic problem all the time. Let’s say the federal government wants to stimulate the economy, to boost aggregate demand and increase gross domestic product. To achieve this goal they would like to build new schools and hospitals, fix public transport, cut taxes and give everyone cash handouts...but they simply do not have the resources to achieve all these ‘wants’ with their scarce resources.

Next time someone asks you what Eco is all about, tell them it’s all about solving a problem.

How bad is COVID-19 for the Australian Economy?

What will be the impact of COVID-19 on the Australian economy? 

The Australian Financial Review asked this very question of a number of economists.

The answer? No-one knows for sure. But economists generally believe it will be very negative for employment and economic growth in Australia.

The AFR article found that economists forecast Australia’s unemployment rate could rise from its current rate of 5.1 per cent (as of February 2020) to 9.4 per cent. This would represent 1.22 million people out of work.

In addition, economists stated that the economy could shrink by 3 per cent. Not to 3 per cent, but by 3 per cent. This would take the Australian economy into negative economic growth and a recession. According to journalist Aaron Patrick, this would create “the worst recession most living Australians have experienced”. 

The AFR article. Click through to read it.

The AFR article. Click through to read it.

Let’s take a look at some of the individual economists’ views. The article spoke to UBS (an investment bank) economist George Tharenou who said that unemployment could reach 10 per cent if businesses weren’t quickly able to operate as normal. 

As of late March, restaurants and cafes around me are restricted to take-away only which has significantly reduced their daily revenues and led to them standing down or letting go of staff. My local cafe has gone from 80 seats and maybe 10 staff to no seats and four staff.

Independent economist Saul Eslake, who was chief economist at ANZ Bank, said that unemployment would peak at 7.5 per cent as the Federal Government’s stimulus packages helped business keep on staff.

As of late March 2020, the Morrison Government had announced two stimulus packages worth around $84 billion with a range of measures targeting businesses to help them retain staff during this challenging time.

Employment is rightly regarded as a major issue right now. Just think about the flow on effects of a significant rise in unemployment. Consumers lose confidence and incomes, which reduces demand for goods and services, which could drive unemployment even higher. Derived demand (the fact that demand for labour is derived from the demand for goods and services) would work in a negative sense. 

This is why government intervention to keep employment as robust as possible is so important right now.

Price ceilings and price floors: an intro

Price ceilings and price floors are confusing. Let’s try and get it clearer.

In real life, a ceiling is the highest point. You can’t go higher than a ceiling. (Sometimes the ceiling is the roof). 

A floor? This is the lowest point. You can’t go lower than the floor. 

Let’s add a layer of complexity.

The ceiling means you can’t go any higher. Therefore this is the maximum point. So, in Economics, a price ceiling means it’s the highest possible price in the market. You can’t go any higher!

The floor means you can’t go any lower. Therefore this is the minimum point. So, in Economics, a price floor means it’s the lowest possible price in the market. You can’t go any lower!

When I draw price floors and price ceilings, I use a small stick figure person to help me get it right. Check out my drawings below (price ceiling and then price floor).

Price ceiling (so the price is the MAXIMUM price).

Price ceiling (so the price is the MAXIMUM price).

Price floor (so the price is the MINIMUM price).

Price floor (so the price is the MINIMUM price).

You can also check out the video below for more.

Today's economics lesson: marshmallows

The study of economics is vast and complex. So, where to start?

When I take an economics class for the first time in Year 11 — day one, lesson one — I start the same way: without talking about economics.

As a teacher, I’m a huge fan of throwing students in the deep end, keeping them confused and guessing and thinking. I don’t feel like thinking happens when I ask students to stay seated, to write a definition of economics and the economic problem, and proceed from there.

Instead I use a hands-on activity to spark interest and engagement. And it involves marshmallows.

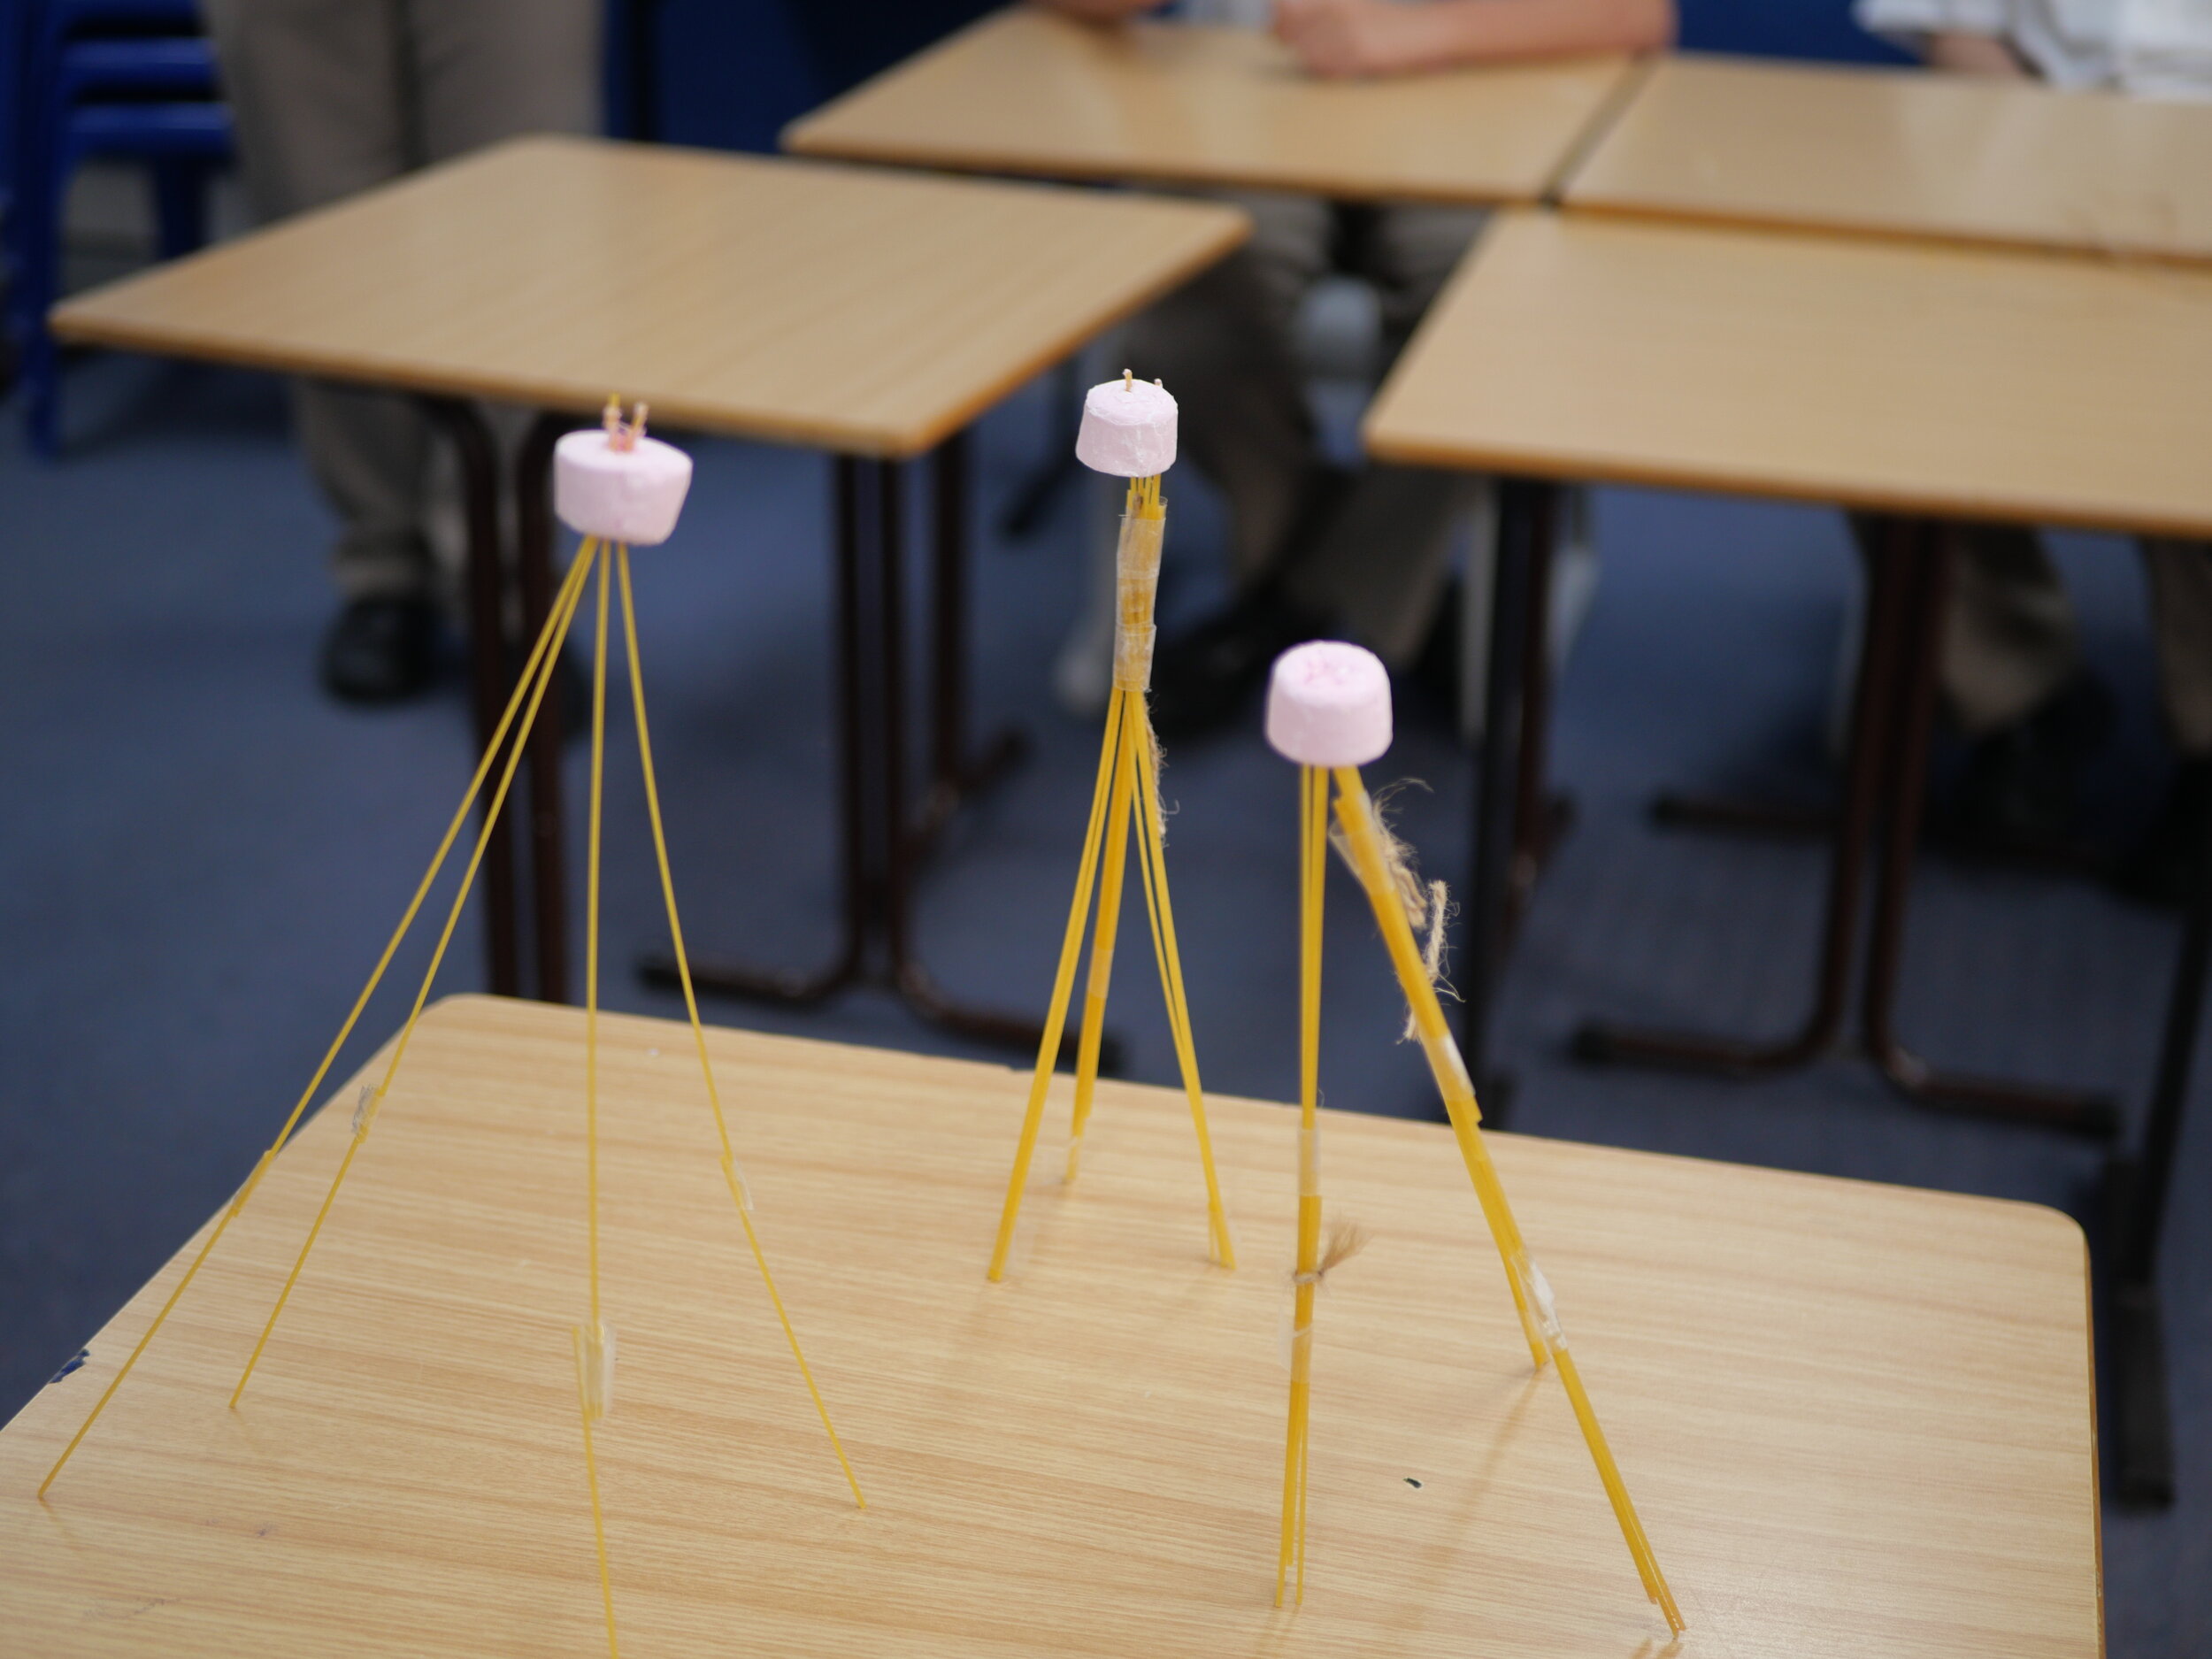
You may be familiar with the marshmallow challenge. People are placed in teams and asked to build the tallest free-standing structure they can create using only the following things:

  • 20 sticks of spaghetti

  • 1m of sticky tape

  • 1m of string

  • Pair of scissors

  • 1 single marshmallow.

The marshmallow must remain whole and intact. It’s placed at the very top of the structure. The structure can’t be attached to anything...you have to be able to pick it up and easily move it. The pasta, string and tape can be cut and broken up.

But this is all you get. Teams can’t get any more of any item.

The participants also have a time limit. I tend to use 20-25 minutes, but you could use less or potentially more. 

I like this challenge because of its adaptability to Economics. As students create their structures, I write down the words and phrases they use on the board (see image below). I want to record their thinking as it takes place, as they experience frustration and encounter challenges.

Verbatim questions/comments from students during the challenge.

Verbatim questions/comments from students during the challenge.

Because...the point of this challenge is to convey the economic problem: unlimited wants, limited resources. It would be much easier if students had days to complete this task, or infinite materials, or access to a qualified builder or engineer, or could consult the internet...the list goes on.

But the point is that, in economics, we have to make decisions with resource constraints: time, money, land, etc. Just as the students have to here.

This usually takes a whole lesson. The next lesson, I ask students to reflect on their experiences in the challenge and then introduce the idea of the economic problem. Which hopefully has more relevance as they’ve just experienced the nature of the economic problem with their marshmallows.

The five sector model (aka the circular flow of income)

Economics can be an incredibly complicated discipline. We do our best to simplify things at times. This is the case with the five sector model, also known as the circular flow of income. 

(In this blog I’m going to call it the five sector model. Both terms are correct.)

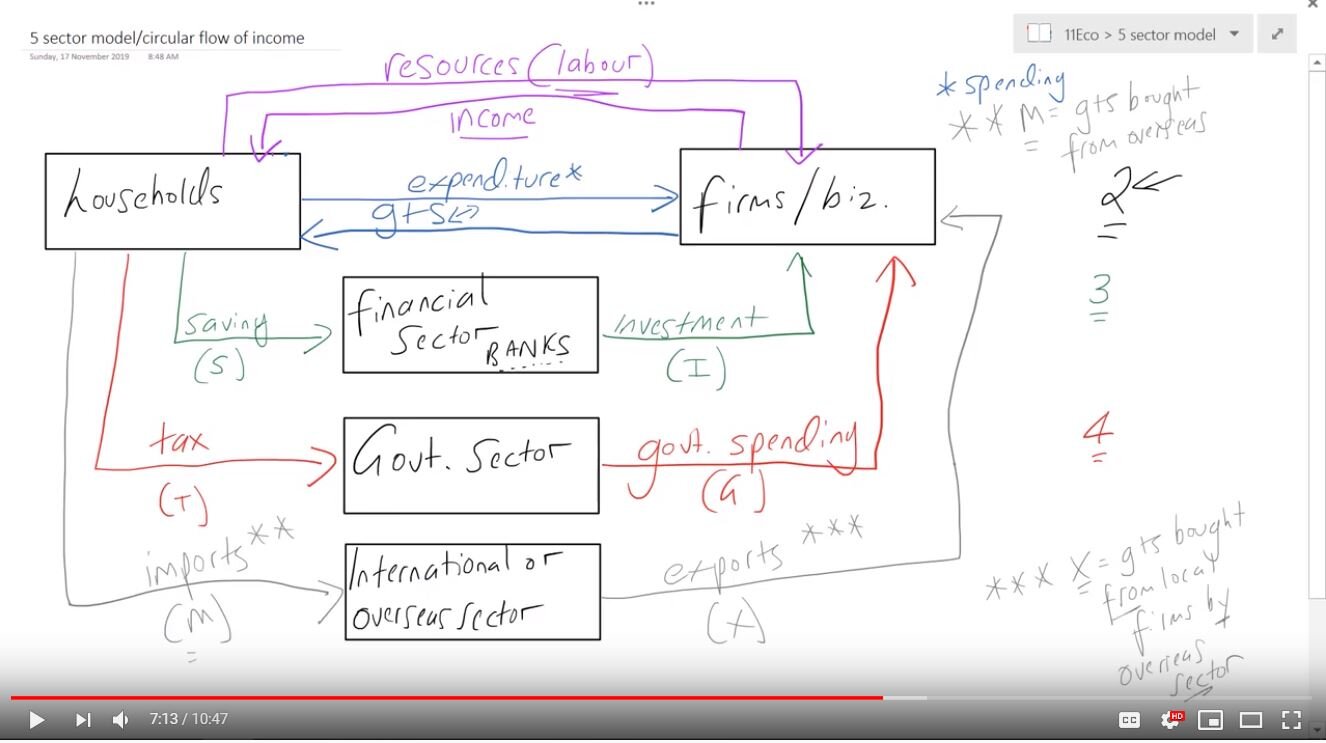
With the five sector model, we take the entire complicated, messy and interconnected economy...and we simplify it into just five sectors. These are:

  • The household sector (essentially individuals in the economy)

  • The firms sector (businesses, companies — this kind of thing)

  • The financial sector (think: banks)

  • The government sector (ah, governments)

  • The international or overseas sector (an economy’s interactions with other economies).

This is what the model looks as a whole (below). But I think the best way to understand this is to start small and build up.

The five sector as a whole.

The five sector as a whole.

Step one: The two sector model

In this model, we just have households and firms. We have simplified the economy enormously!

Households supply firms with resources (such as labour). Then, firms supply households with wages in exchange for their labour.

Another flow is that households purchase goods and services produced by firms. So firms provide households with goods and services, and households buy these goods and services (known as consumption).

Step two: The three sector model

We now add the financial sector. 

Households deposit their savings with the financial sector. The financial sector then lends these savings to firms to help them grow and expand (this is known as investment).

Step three: The four sector model

We now include the government into our simplified model of the economy.

Governments collect taxes from households (so, households pay tax to the government). The government then spends money in the economy in many ways, including unemployment benefits and infrastructure spending. As a whole, this is called government spending. 

Step four: The five sector model

Now, we include other economies (from other countries). This is called the international or overseas sector. 

Let’s say we’re talking about the Australian economy. Households buy goods and services from overseas. These are called imports and involve money leaving Australia. Then, Australian firms sell goods and services overseas. These are called exports and involve money flowing into Australia.

A little extra

When we talk about the five sector model, we discuss money flowing into the economy (injections) and money leaving the economy (leakages). I discuss this in detail in the video below, but here’s a summary table that can help. You can also read on about the five sector model and variables such as economic growth, unemployment and inflation.

Capture_22.JPG

Supply?

So, what is supply?

Let’s start at a very high level. With demand, we are thinking about consumers. We are thinking about people who want (demand) goods and services in the market. 

But consumers can’t make all these fancy goods and services themselves. They need a little help.

Supply is all about production. Supply is about firms (businesses, producers, it’s all the same here) producing the goods and services for consumers to, well, consume. 

In a market, consumers demand goods and services, and firms supply the goods and services.

But!

Because we’re doing economics, there’s always a but. In some markets, the roles are reversed. For example, in a labour market, individuals supply labour and firms demand this labour. So when we say consumers demand goods and services, and firms supply these goods and services, we are talking about a product market.

The Law of Supply

At different prices, firms will act in different ways. You might recall that at different prices, consumers will act in different ways. Generally, the higher the price, the lower the quantity that consumers demand.

Supply is the quantity of goods and/or services that firms in a particular industry are willing and able to sell at different price levels. For firms, there is a DIRECT relationship between price and quantity supplied.

What do I mean here? As price goes up, firms will wish to supply more to the market. 

Why? For two reasons. First, as price rises, firms realise that they can make more revenue if they sell more products (revenue = price * quantity sold). Second, as price goes up, more firms get the signal that they should produce more because they too could make more revenue as the price rises. 

The bottom line: as price rises, quantity supplied in a market will also rise. There is a direct relationship between the two variables.

Supply schedule and supply curve

The supply schedule sets out the level of quantity supplied at different price levels. It’s typically shown in a table, like the one below.

Hi, I’m a supply schedule.

Hi, I’m a supply schedule.

We can then use the supply schedule to construct a supply curve. The supply curve is upward sloping because as price rises, so will quantity supplied. You can see this in the curve below: as the price rises from $1 per unit to $6 per unit, the quantity supplied will rise from 20 to 120 units.

A messy supply curve. Please, be neater.

A messy supply curve. Please, be neater.

The video below goes into more detail about the economic concept of supply.

A plan of attack for exchange rates

This term, I’m not going to be around to start the exchange rates topic with my class. Instead, I’m leaving them a workbook and will pick up the pieces when I return. 

I’m generally not a fan of workbooks. My preferred method is to have students complete pre-learning of the content at home, mainly via flipped videos, and then undertake hands-on activities in class to apply the knowledge.

But, if I’m not going to be there for the latter, the whole process is a little undermined.

So to cover all possibilities in terms of sub teachers, etc, I’m leaving a workbook for students. This covers the core concepts around exchange rates, including textbook references and hyperlinks to flipped videos, as well as past HSC questions. I thought it might be useful to share in case you need ideas for a lesson, resources or questions, or just a plan of attack for this topic.

Access the workbook (PDF format).

If you use it, let me know how it goes. Any suggestions would be gratefully received.

The Australian economy in 2020 (maybe)

What should we expect from the Australian economy in 2020?

Forecasting the future is a tough game, but economist Stephen Koukoulas has given it a go. In an article for Yahoo Finance, Koukoulas has taken a look ahead into the future for the Australian economy. I’ve focused on four of his predictions and you can read his full article for more.

Australia’s Economic Growth

In 2019, Australia’s annual growth in gross domestic product (GDP) was relatively weak. GDP averaged around 1.7 per cent in annual terms. Compare that with the government’s goal for economic growth of around 3-4 per cent in annual terms.

In his article, Koukoulas presents an optimistic case for Australia’s GDP. He suggests it could reach 2.5 per cent by mid-2020 and perhaps as high as 3 per cent by the end of this year.

His relative optimism is based on three factors:

  • A rise in public sector spending, particularly in infrastructure (this represents government spending, or G, in the aggregate demand equation)

  • Increased business investment, potentially helped by record low interest rates in Australia

  • Increased consumption, boosted by a recovery in consumer confidence and the wealth effect (where rising asset prices, house prices in Australia’s case, encourage consumers to boost spending).

Australia’s Unemployment

In 2019, Australia’s labour market was relatively weak and unemployment did not budge far from the 5 to 5.2 per cent range. Koukoulas believes UE could rise even further to around 5.5 per cent in 2020.

But! If the predictions around higher economic growth come true, unemployment will likely fall. Koukoulas states that if GDP growth hits 3 per cent, then we will see noticeable falls in unemployment and underemployment.

Why is this the case? Well, if economic growth rises, this means there is greater production of goods and services in the Australian economy. To achieve this, local firms will need additional factors of production (or resources) — particularly labour. They will demand more labour, which will push down UE. (This is known as derived demand, where the demand for labour is derived from the demand for goods and services).

Inflation in Australia

The Reserve Bank of Australia’s goal is to keep inflation between 2 to 3 per cent over the course of the business cycle. This is known as the target band. For the duration of 2019, Australia’s inflation rate was below the target band.

Koukoulas says if the economic growth mentioned above takes place, inflation will likely rise to 2 per cent or to sit inside the target band. This demonstrates the link between economic growth and inflation: as economic growth rises, the demand for goods and services will also rise, leading to higher prices and inflation.

The Australian Dollar

In late 2019, the $A traded around the US$0.66-US$0.68 mark. However, Koukoulas believes the $A could be trading as high as US$0.77 in 2020.

He presents two potential reasons for this appreciation:

  • Improving global economic growth will lead to higher demand for Australia’s commodity exports. This will increase demand for the $A as buyers need local currency to purchase Australian exports.

  • Improving domestic conditions could lead to greater investment in the Australian economy. To participate in this, foreign investors will need $A, which will also cause the currency to appreciate.

One point I would add here is that a stronger $A will make exports more expensive and less internationally competitive. This could result in Australia actually selling fewer exports, which may have negative consequences for the trade balance and the Balance of Payments.

We’ll be watching this year to see how these forecasts unfold.

Demand. The basics

Demand is a pretty fundamental part of Economics. Put simply, demand is how much stuff people want at different price levels.

More formally: demand is the level of goods and services consumers are willing and able to purchase at different price levels.

Think about your demand for something. Generally, the higher the price, the less of a good or service you would be prepared to buy. And we can take this idea into an economic concept known as the law of demand. 

The law of demand states that the higher the price of a good or service, the less consumers will demand of it.

Indeed, there is an inverse relationship between price and quantity demanded. The relationship is inverse in that as one goes up, the other goes down. As price rises, quantity demanded will fall — and vice versa.

Let’s go through a hypothetical example of this using the price and quantity demanded for waterbottles in an economy.

At a price of $2, waterbottles are relatively cheap so people are keen to snap them up. For an individual, at a price of $2, they will demand 20 waterbottles. They’ll buy some for now and some for later — it’s such a great deal!

But if the price rises, consumers will be less likely to buy waterbottles. In fact, they will no longer buy 20 waterbottles. If price rises to $10, they may only be willing and able to buy four waterbottles as it’s more expensive. 

demand schedule.JPG

We could create a table like the one on the right. All the numbers are made up — it’s a hypothetical example after all.

This table neatly displays the law of demand. As price rises, quantity demand (often abbreviated to QD) will fall. And from this table, known as a demand schedule, we can construct the actual demand curve. Check it out below.

deamdn curve.JPG

If you’re keen on more, there’s a video on this too (see below).

Another tough protection question (2019 HSC)

In the NSW Economics HSC, questions 19 and 20 are typically the trickiest multiple choice. This was the case in the 2019 Economics HSC exam. 

This is the graph that applies to both questions.

Q overall.JPG

Even before I’ve looked at Q19, this is how I annotated the question.

annotated graph.jpg

You can see from the question that the world price is $3. Point A represents domestic supply and point B represents domestic demand. This gives us a shortage of domestic demand of 40,000 units. This gap will be filled by imports (the distance between point A and point B).

Another point that can be useful to know is point C. This is where domestic demand equals domestic supply and imports equals zero (there are NO imports).

I think we’re ready to try Q19. You can see my annotations below.

Q19 annotated only.jpg

In Q19, the first bit of relevant info is that the government wants to impose a tariff that will keep imports to 20,000 units. This is the point of an import quota of 20,000 units: imports will be limited to 20,000 units ONLY.

Go back to the original graph. Imports will equal 20,000 at a price of $4. Check for yourself: at $4, domestic supply is 30,000 while domestic demand is 50,000 — imports of 20,000 will fill the gap.

So, how does the government go from a world price of $3 to an artificial price of $4? It imposes a tariff of $1 per unit. In other words, the tariff price will be $4 (world price of $3 plus the tariff of $1).

The focus of the question is about the total tariff revenue that will be generated for the government. The formula for this is = the size of the tariff * the number of imports.

In this question it will be $1 * 20,000 = $20,000. Your answer is C.

Now, time for the trickier one. Time for Q20. Here’s my annotations and then I’ll walk you through it.

Q20 only_for web.jpg

This is a tough one, so let’s go slow.

Our starting point is the world price — which is $3.

At $3, we know that the size of imports is 40,000 units. 

If there are NO IMPORTS, which is the focus of the question, domestic supply must equal domestic demand. At the world price ($3), domestic demand is 60,000 and domestic supply is 20,000. For there to be NO IMPORTS, domestic supply will need to equal 60,000.

Go back to the original graph. Where does domestic supply equal 60,000 units? When price is $7.

Therefore, if the world price is $3, the government must pay a subsidy of $4 per unit to raise the price to $7 and ensure domestic production is 60,000 units. Your answer is D. 

Questions in the comments!

Get clear on direct vs portfolio investment

Let’s turn to the Balance of Payments (BoP). This is the record of transactions (money coming into Australia; funds leaving Australia) between Australia and the rest of the world. 

The BoP is divided into two accounts: the  Current Account and the Capital and Financial Account (KAFA). We’ll focus on the KAFA.

(Why is the abbreviation for the Capital and Financial Account KAFA? Because the symbol for capital is ‘K’. Not ‘C’. C is for consumption).

The KAFA itself is divided into the Capital Account (the KA part) and the Financial Account (the FA part). 

So many abbreviations.

Anyway, let’s stay with the FA part of the KAFA.

The FA has five main components:

  • Direct investment

  • Portfolio investment

  • Financial derivatives

  • Reserve assets

  • Other investment.

For this post, we’ll focus on direct and portfolio investment. 

The key here is the 10 per cent figure. Less than 10 per cent — think portfolio investment. Above 10 per cent — think direct investment.

Portfolio investment

Think about an investment portfolio. This typically involves an individual holding a mix of investments, all of which are relatively small. The same logic applies here.

Portfolio investment involves an individual or a firm buying shares in an existing business. The size of this investment is less than 10 per cent of existing shares in the company.

An example? An American investor purchases A$1,000 worth of Telstra shares. The value (market capitalisation) of Telstra is A$42 billion as of November 2019. Clearly, this small investment is much less than 10 per cent of the value of the business!

Direct investment

This is all about creating totally new investment or buying more than 10 per cent of shares in an existing company. 

So, we might see an Australian company buy more than 10 per cent of shares in an American company (this is also sometimes referred to as the Australian company taking a controlling stake in the US business). We could also see a foreign company start a subsidiary business in Australia (an Australian offshoot of its foreign operations; essentially the creation of a new business in Australia).

The key here is the 10 per cent figure. Less than 10 per cent — think portfolio investment. Above 10 per cent — think direct investment.

Don't teach your students about the types of unemployment

Class time is wild precious. And it’s very limited. So, as Economics teachers (indeed, as all teachers) we have to maximise the value students get from our classes. In my opinion, we should stop wasting class time by teaching relatively straightforward content.

Let me give you an example.

In the NSW HSC Economics course, students are required to know the types of unemployment (cyclical, structural, frictional and so on). This content is not up for debate. There is no controversy over defining the types of unemployment.

Put it more simply, students don’t have to ‘analyse’ or ‘discuss’ the definition of cyclical unemployment. They have to engage with the concept, but the basics of knowing what it is — that’s not worthy of class time.

If I have a 45-ish minute lesson, teaching the types of unemployment could take a large chunk of this time, leaving little time for application and thinking

My message: don’t teach your students about the types of unemployment. Let someone else do it.

You could let me do it (see right). You could outsource it to someone else on YouTube, or you could even outsource it to your virtual self in the form of a flipped video.

Set this content for homework. The class time can now be used to have students engage with the types of unemployment.

Some ideas: 

  • how the types of unemployment interact with each other (such as structural leading to long-term leading to hidden)

  • how to solve the different types of unemployment

  • real world examples of the different types of unemployment (such as automation in the context of structural change)

  • past exam questions (multis and shorts) to practice and work on as a class.

I think the latter approaches encourage thinking. And it’s hard for students to learn without engaging in thinking. You can also think about this approach in other instances where students just need to know facts.

The business cycle

The business cycle demonstrates fluctuations in the level of economic activity over time. More simply, the business cycle is a graph that shows how the output of goods and services, measured by gross domestic product (GDP), varies over time.

We tend to highlight four stages of the business cycle. I’ve matched them with the letters from my graph below.

‘Business cycle’. Artist: Mr Symonds

‘Business cycle’. Artist: Mr Symonds

Point A: The upswing

This is where the economy is expanding (GDP is growing). It is producing more and more goods and services. Hooray! 

At this stage, here’s what we’re seeing:

  • Rising incomes

  • Higher consumption and investment

  • Unemployment is falling, as firms need more workers to meet the growing demand for goods and services

Part B: The BOOM

This is the peak point of economic activity. Essentially, the economy’s output is getting ‘maxed out’ and extra resources are in short supply. As a result, production costs rise which leads to growing inflation across the economy. 

Given the rise in inflation, the government and the Reserve Bank of Australia (RBA) might need to intervene with contractionary macroeconomic policies (fiscal and monetary) to slow things right down.

Part C: The downturn (or downswing if you prefer)

Economic activity slows, leading to a fall in output. We’re likely to see less demand for goods and services, which leads to less demand for labour, resulting in a rise in unemployment. Incomes will also fall as a result. This are getting worse, economically speaking.

Part D: The recession

This is a very difficult situation. Output has fallen further leading to less demand for labour, lower wages and higher unemployment...which in turn leads to less demand for output and even lower wages and higher unemployment, and so on. Prices are falling and an economy may even experience deflation (not a good thing — see here). 

To combat this situation (to fix this situation), the government and RBA will likely need implement expansionary macroeconomic policies to accelerate economic activity.

Feel free to draw the business cycle diagram in short answers and essays to illustrate your point. It can add a little extra to your responses.

They won't plan their essay (but they should)

Teaching is a great profession for throwing around the phrase, “If I had a dollar for every time I’d told them…” As teachers, we apply it to many things. As an Economics teacher, I apply it to essay planning.

Economics essays are challenging. In my experience, there are no magic formulas or winning scaffolds. Students have to fully engage with the unique question and provide a solid mix of economic theory and current stats to support their discussion. 

And it really is more of a discussion. That’s how I view it. In the NSW Economics HSC, you’re not really creating a thesis statement and rattling it off at every opportunity. Instead, you’ve got to engage with the question...as messy as it might be (I see you 2018 Eco HSC Q26). 

Well, this escalated quickly. From the 2018 Eco HSC.

Well, this escalated quickly. From the 2018 Eco HSC.

But this is hard. Students, understandably, want scaffolds and structures and guaranteed ways to land Band 6s. And lots of people promise this. So, as a teacher, how do you get students to think differently about essays?

My ongoing challenge is to have students make meaningful attempts to plan their extended responses. With 20 marks on offer, I don’t want them to simply start writing and see where it leads. I want them to have a roadmap and follow this closely as the clocks ticks. 

In working with students, I’m not fussed about how their essay plans look. I prefer them to be messy with lots of evidence of exploration and thinking. Practice plans can be long; in an exam, they’d probably need to be shorter and tighter. If I had to sum up my ideal process, I’d like students to throw all their ideas out there (in response to the question), and then rearrange them in a way that makes sense.

Perhaps the best way to demonstrate this is to show you. The video below is my process of engaging with a tricky but common Balance of Payments essay question. You can see how I go about addressing the question, in a comprehensive way, before I’d even write a formal word.

How important is essay planning in your practice? How do you get students to undertake planning in exam situations?

Maximum multiplier madness (2013 HSC exam)

Here’s a past question from the 2013 NSW Economics HSC exam. It’s multiplier focused, for maximum multiplier madness.

Source: NESA (click through for full exam)

Source: NESA (click through for full exam)

This is a bit trickier than some other multiplier questions because it’s a different way of examining the same content. There are no numbers, no need to hunt for changes to national income or the multiplier itself. 

Still, I think the best way to play this is to actually use numbers. 

For instance, the question tells us the MPC has declined. So, let’s create two scenarios:

  • Scenario one: MPC is 0.6

  • Scenario two: MPC is 0.3.

If MPC is 0.6, then MPS is 0.4. So the multiplier (k=1/MPS) would be 2.5 in scenario one.

Cool. Then, if MPC is 0.3, then MPS is 0.7. So the multiplier (1/MPS) would be 1.43 (2dp).

So, as the MPC falls, the size of the multiplier shrinks. This makes sense because the less spending that takes place (MPC), the less money that gets multiplied around the economy.

And if the multiplier falls, then the initial injection of aggregate demand will be multiplied fewer times and result in a fall in equilibrium income.

Hence, our answer is B.

You can also see the worked solution below.

Solution for the question starts at 2:47.